Do you manage your own finances or use a ‘financial advisor’? Understanding the full capabilities of a financial planner is crucial. Why? Because while advisor fees may seem similar, the level of service can vary significantly.
We can help you build a comprehensive plan in just 4 hours. We understand your time is valuable, and we’re here to make the planning process efficient and effective.
Here’s how we can help:
Tax Planning
1.) Claiming Tax Deductions and Credits: We uncover opportunities to maximize your tax savings, whether you’re saving for college, running a business, or in your peak earning years. Did you know about Solo 401(k)s or Profit Sharing 401(k) contributions with limits up to $69,000 in 2024?
2.) Tax-Free and Tax-Deferred Investing: We analyze your situation to determine the best strategies for your pre-tax and Roth contributions, considering your career trajectory, tax projections, benefits, health, and goals.
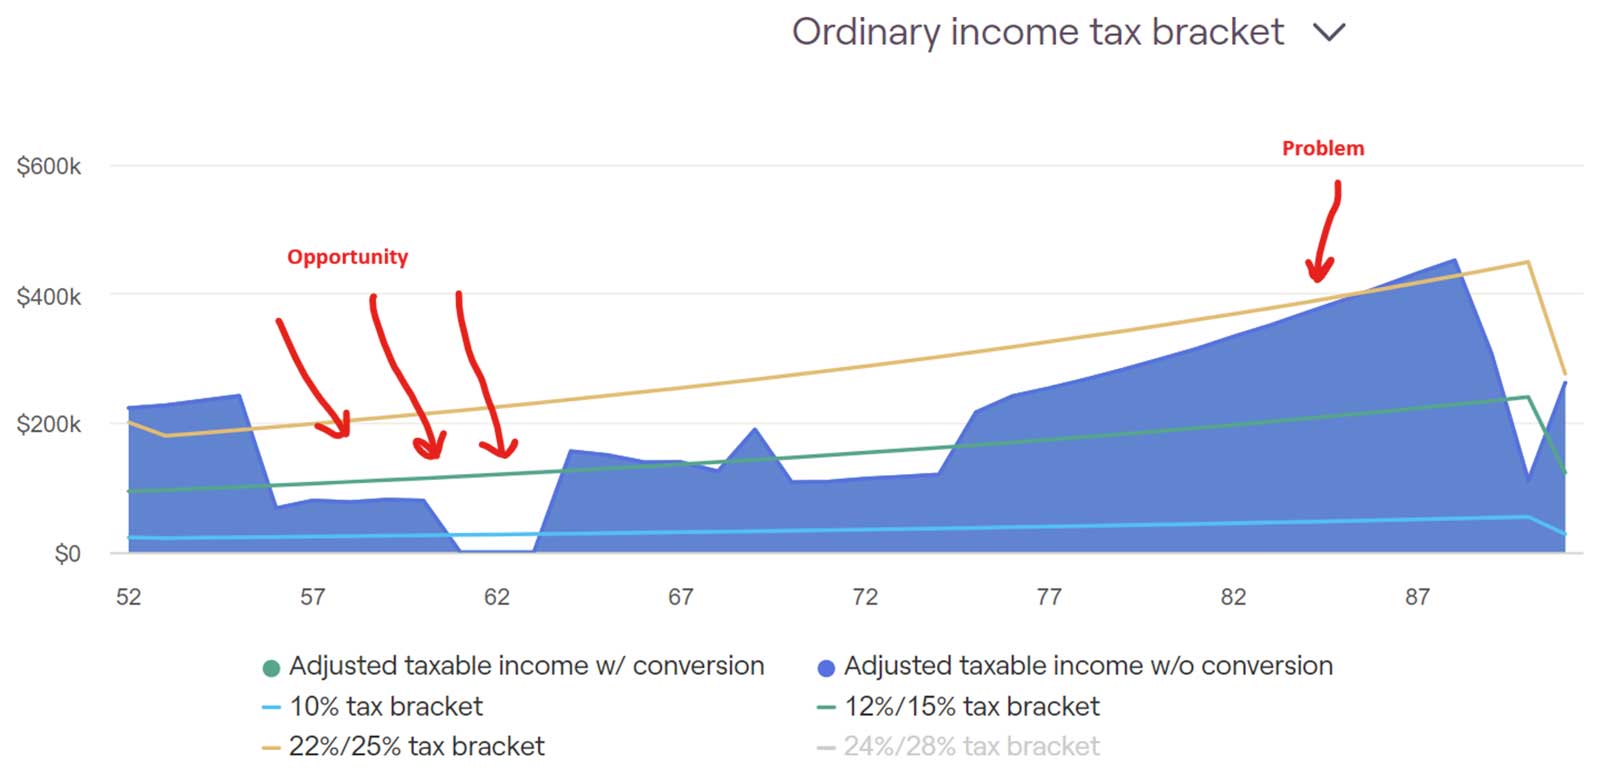
3.) Tax Bracket Planning: Are you having an unusually high or low taxable income year? We find opportunities for your investments to be taxed at lower rates by planning ahead and making the most of current rates. Have you heard of 0% long term capital gains rates? Have you seen the tax projection of your required minimum distributions from pre tax retirement accounts? Tax efficiency is crucial!
Estate Planning
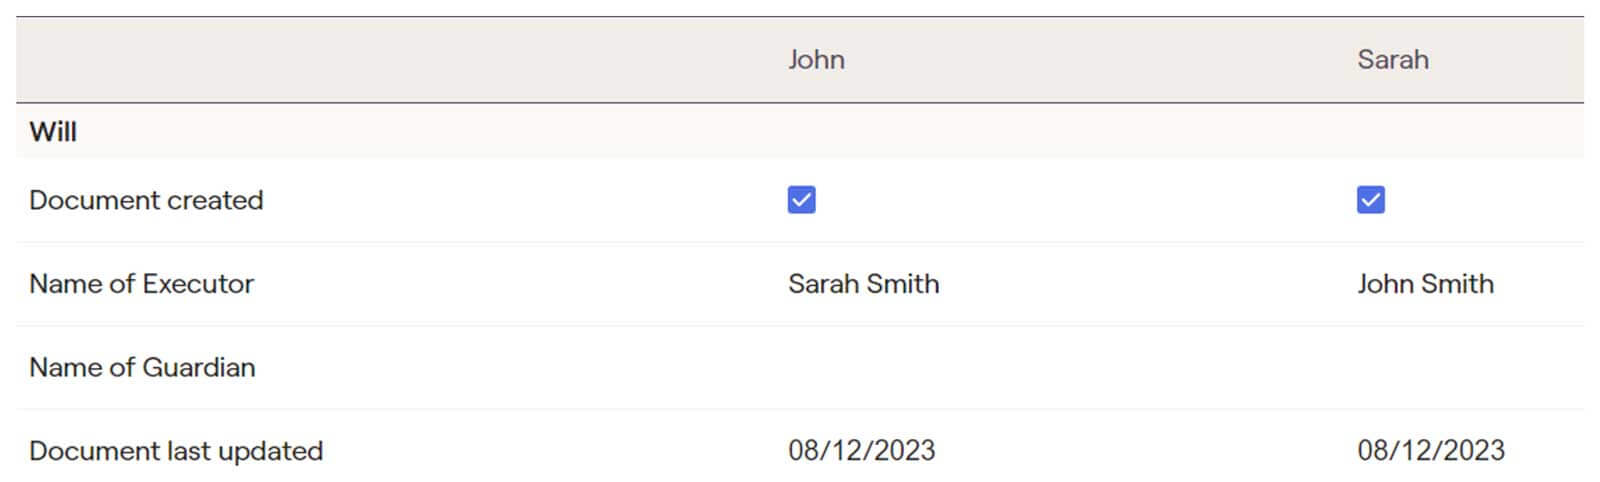
4.) Probate and Settlement Cost Savings: We ensure you have a complete estate plan, including a Will, HIPAA Authorization, Advance Healthcare Directive, and Power of Attorney. We guide you through beneficiary designations and explain complex terms like “per stirpes.” We have partners to assist with the legal documents required for implementation.
5.) Asset Transfer Accuracy and Efficiency: If something happens to you, who does your spouse or loved ones trust to ensure a smooth transition? We are the trusted partner to raise red flags when necessary and reinforce your intent. Are your beneficiaries financially savvy? We are committed to educate, uphold the fiduciary standard, and be endlessly patient in the process.
Retirement Planning
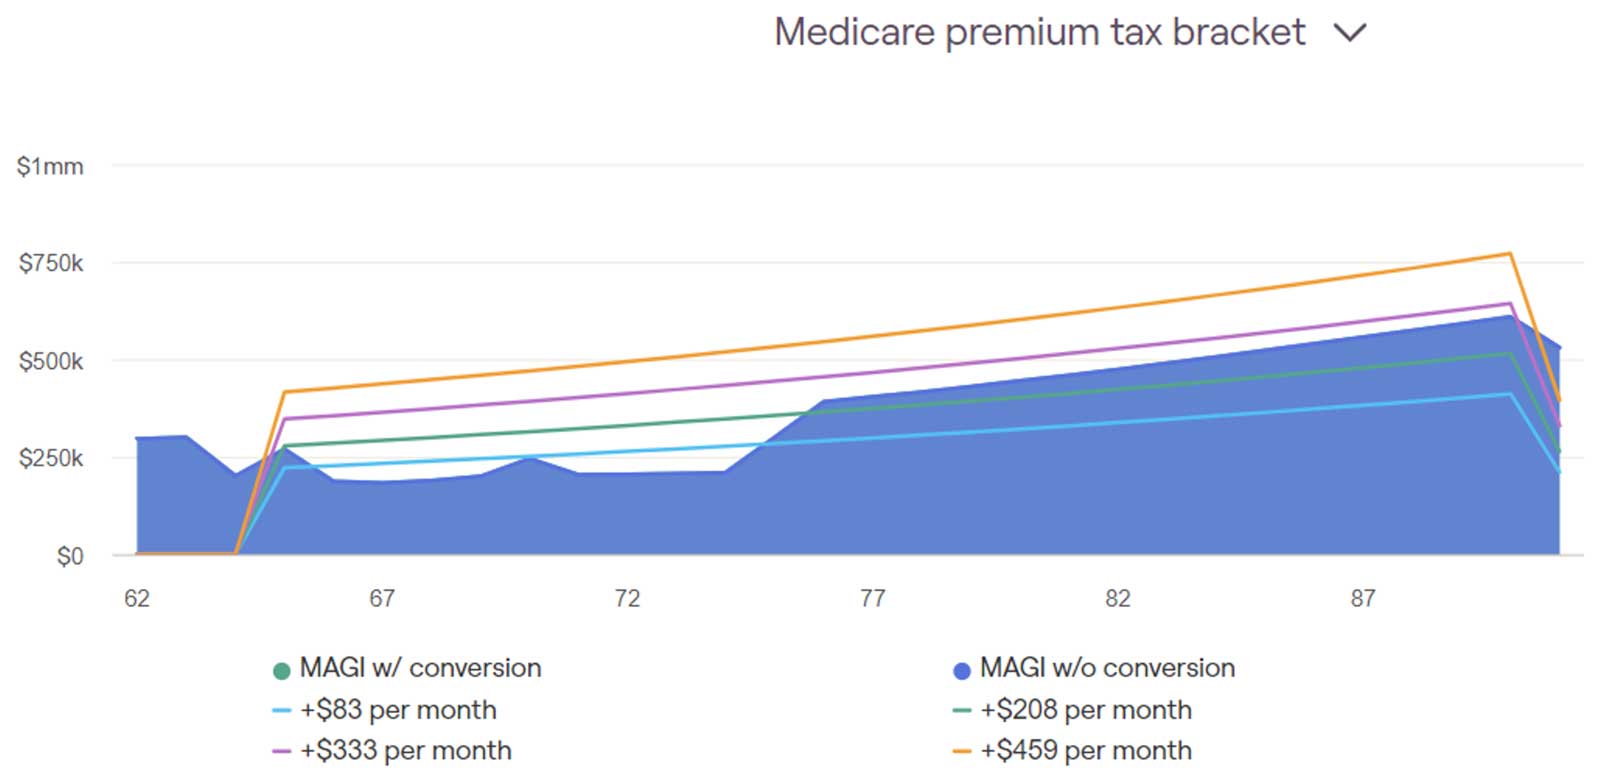
6.) Retirement Withdrawal Tax Strategies: We navigate the complexities of Social Security taxation, Medicare Part B premiums, and withdrawals from pre-tax retirement accounts to optimize your retirement income.
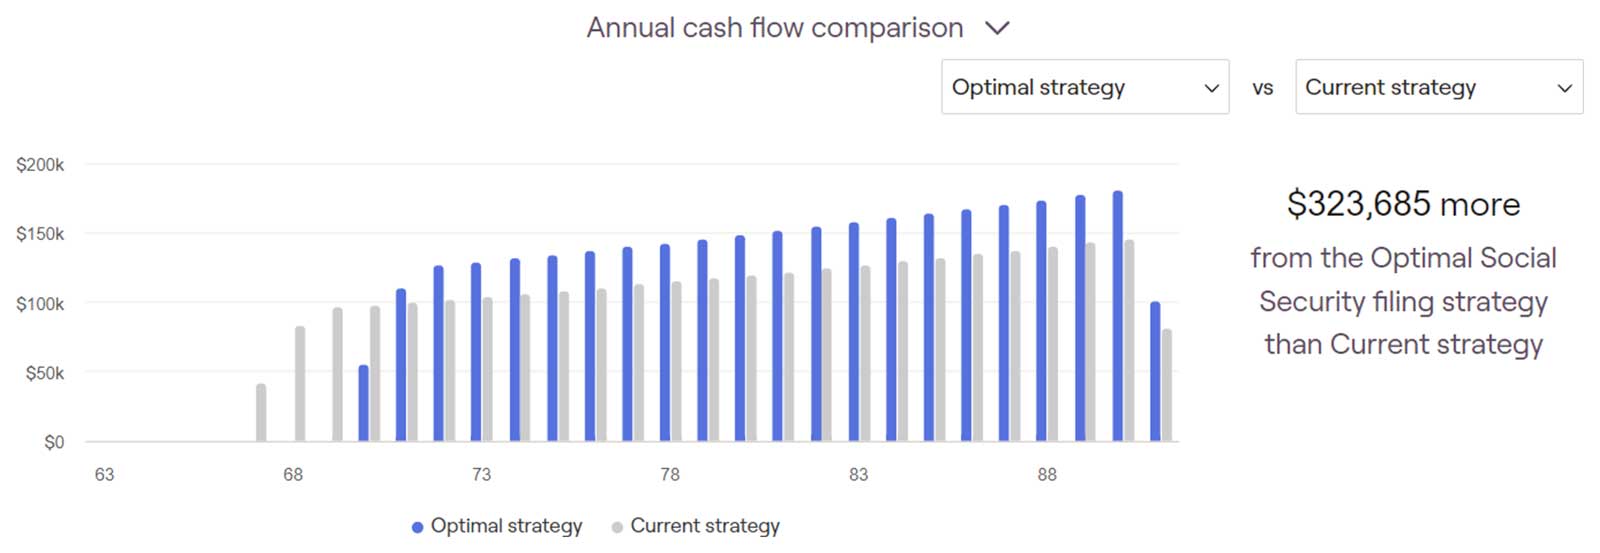
7.) Maximizing Social Security Benefits: We help you understand the intricacies of Social Security and choose the best claiming strategy for your situation. This is a complex system with layers of pros and cons to talk about before the right path for you is selected.
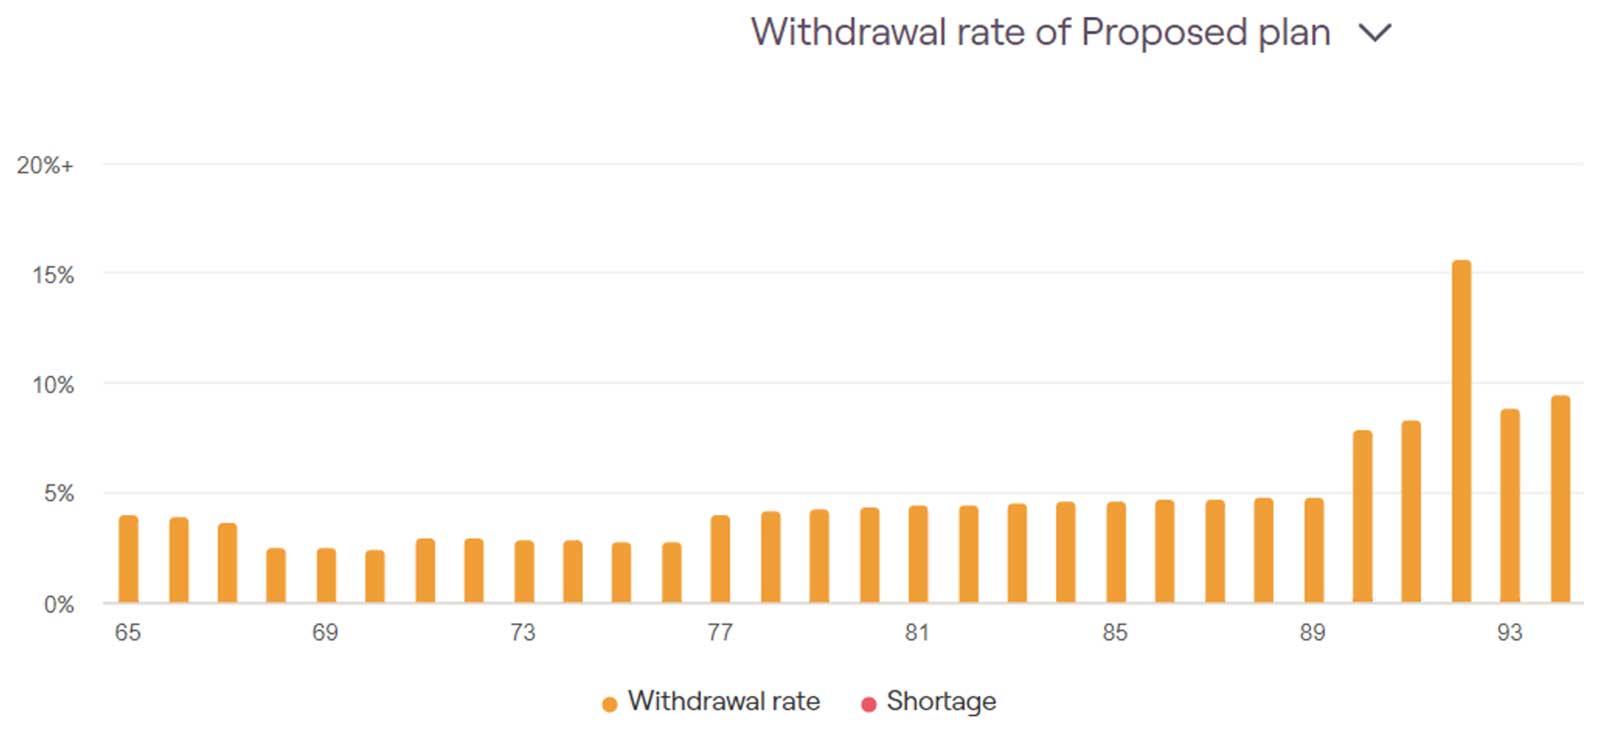
8.) Retirement Spending Guidelines: We provide guidance on sustainable withdrawal rates and help you find the right balance between enjoying your retirement and ensuring your funds last.
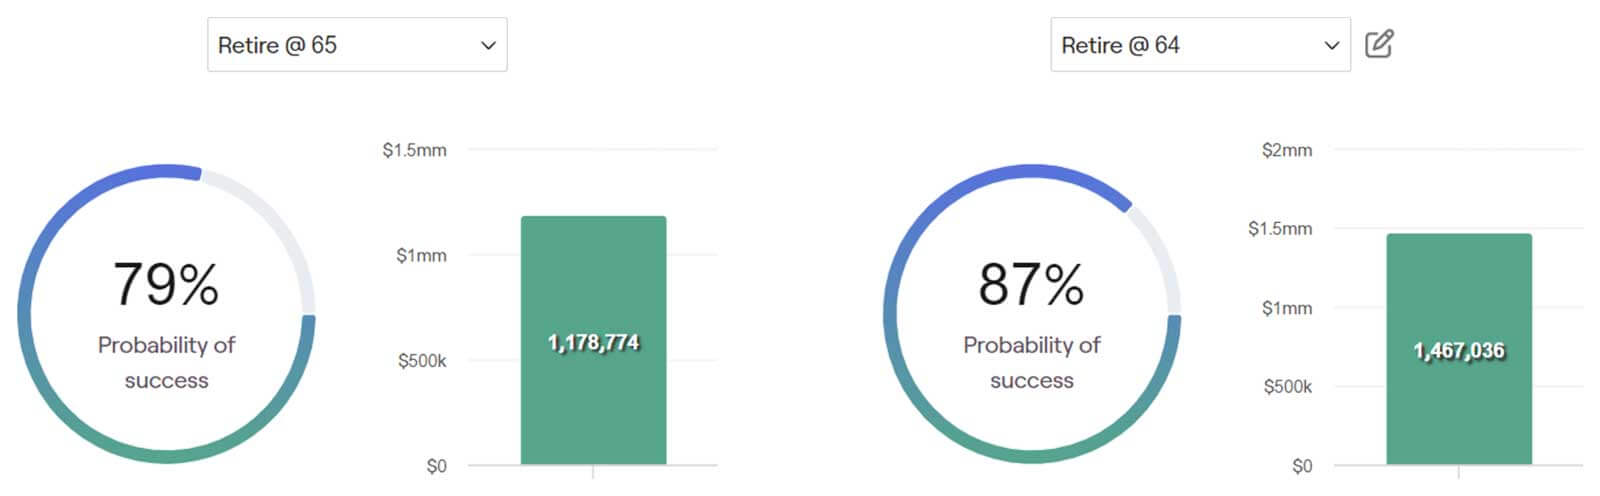
9.) When Can I Retire? We determine your ideal retirement age based on your financial goals and resources, showing the impact of early or late retirement.
Insurance Planning
10.) Optimize Life Insurance: We analyze your needs and determine the appropriate level of life insurance coverage to protect your loved ones.
Behavioral and Well-Being Benefits
11.) Enhance the Value of Your Time: We handle the complexities of financial planning, allowing you to focus on your career and personal life. Our clients are skilled in their professions but sometimes have a blind spot in financial literacy. That’s our job. We educate, optimize, and implement so you spend less time practicing on your own finances.
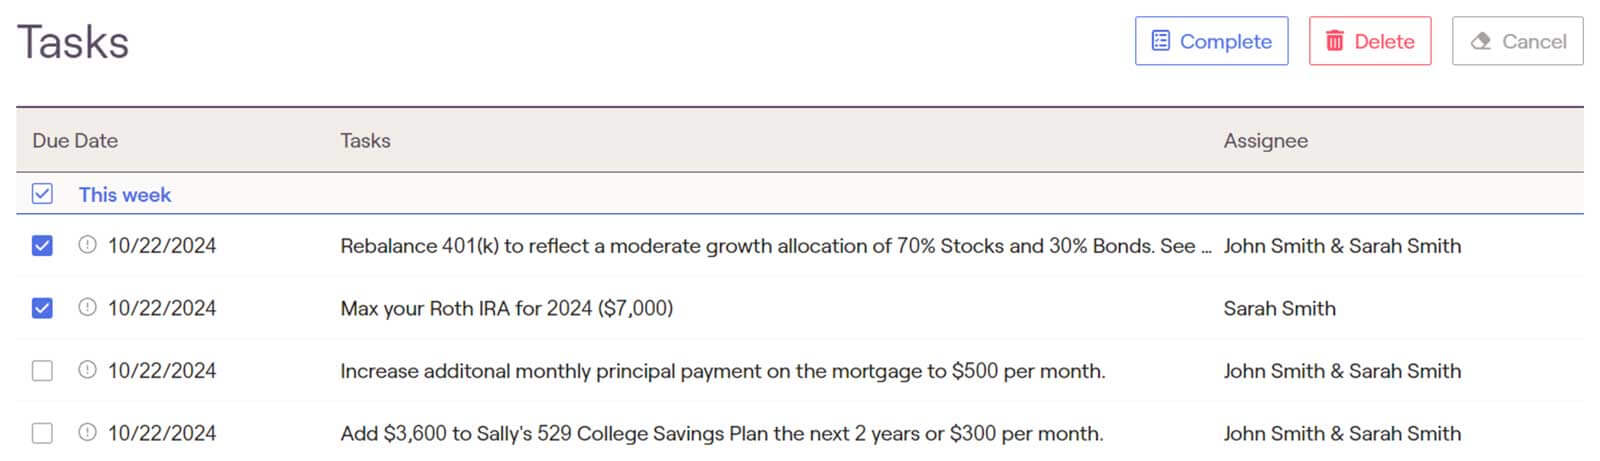
12.) Ensure Implementation: We keep you accountable to your financial plan, helping you stay on track and achieve your goals. Life in the 21st century can get overwhelming. One of our most crucial functions as a financial planner is holding you accountable to the plan we developed.
13.) Eliminate Biases: We provide objective guidance to help you overcome emotional biases that can hinder your financial decision-making. We lend perspective on what matters the most to help you eliminate some future regret.
“There’s no such thing as the perfect plan, but people with a plan tend to do better.” — Ken Bellavance
Investment Planning
14.) Tax Loss Harvesting: This is a fancy term for selling investments to offset taxable gains with losses, WITHOUT changing your potential or progress towards your financial goals. This is often overlooked due to complacency or ignored to due complexity
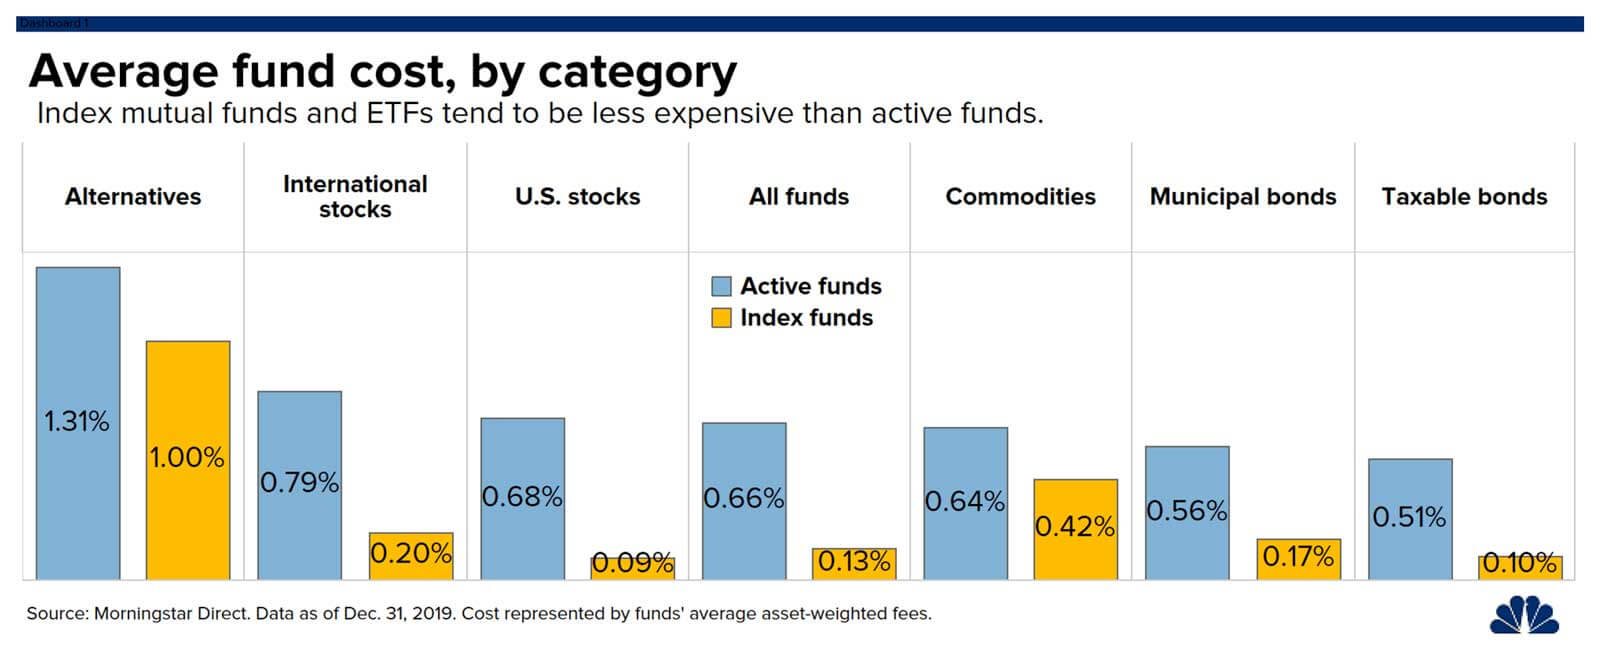
15.) Low-Cost Investing: What is the difference between ETFs and mutual funds? Why do costs matter? What investment costs are reasonable? Why can’t I just pick the funds with the best trailing performance? 😟 Because no one can predict the future, fees matter.
16.) Rebalancing: Another fancy term for the process of selling what works and buying what is lagging. Why? Because most investments do not permanently advance without noticeable setbacks. We don’t just rebalance because it’s popular. We rebalance when we feel it’s justified.
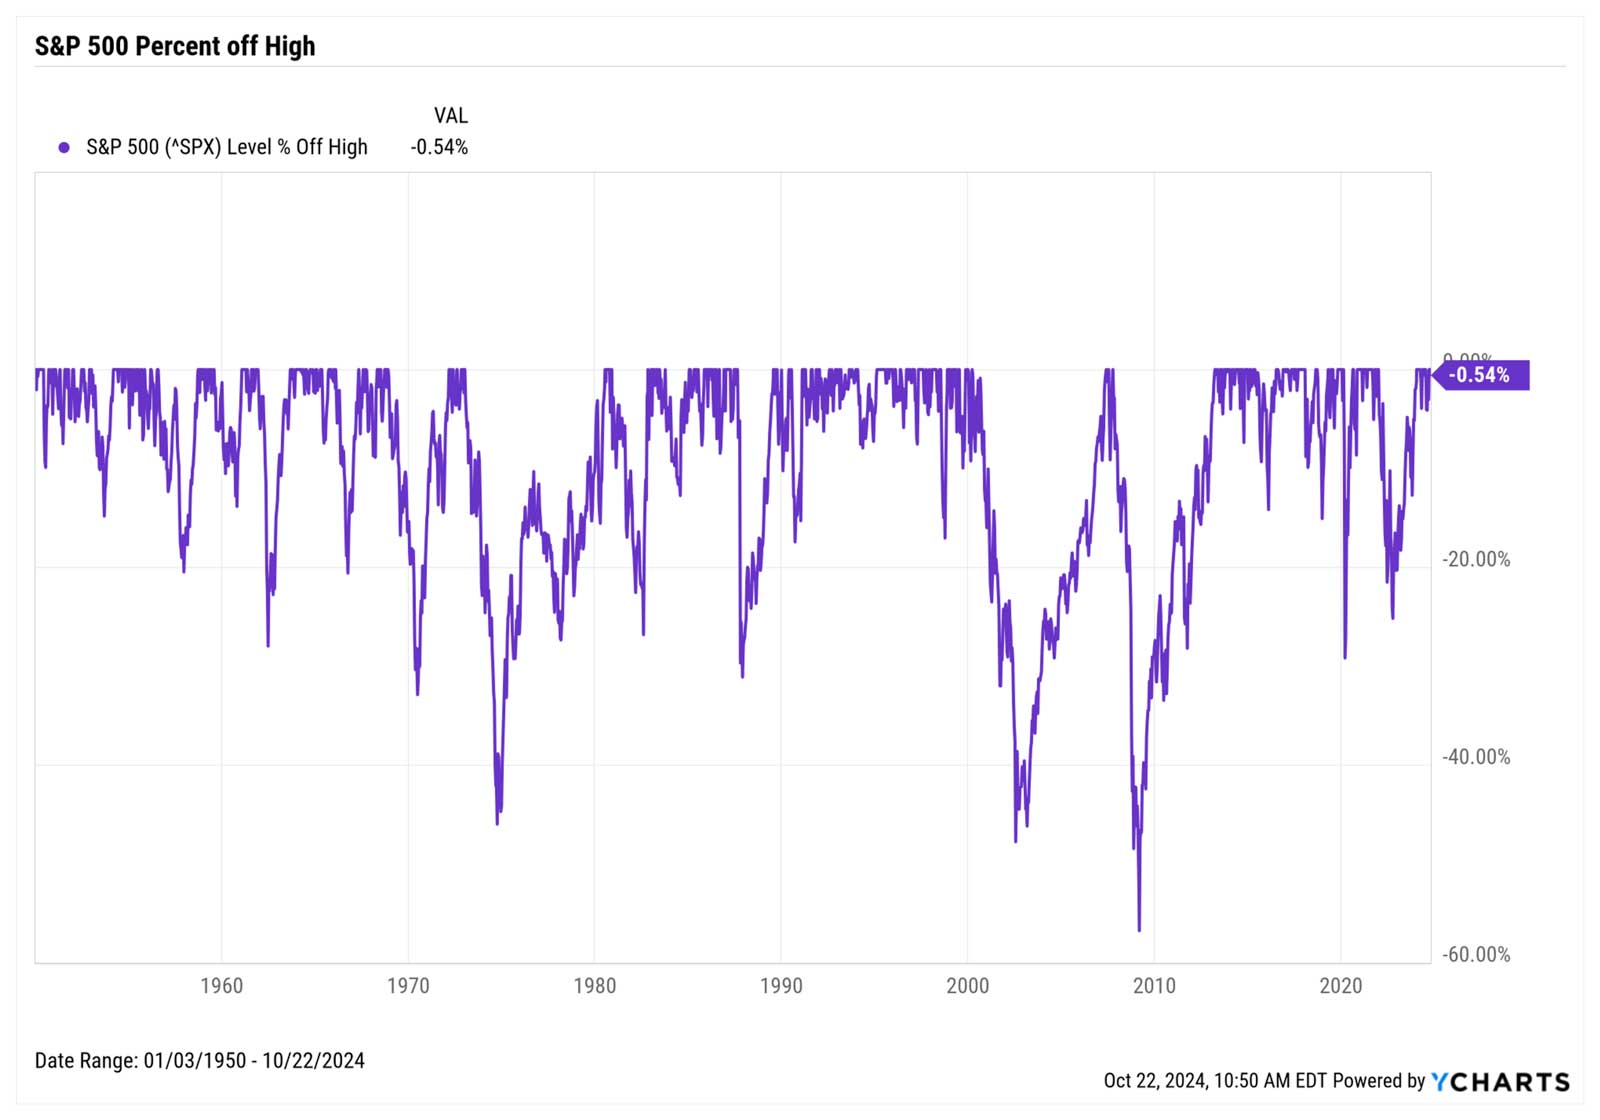
17.) Diversification: Why should I diversify? Risks exist at the company level, sector level, country level, and many more. We are intentional to invest in various categories with their own unique potential for capital appreciation.
18.) Risk Location: What level of risk are you taking with your investments? Which account of yours is more aggressive and which is more conservative? Why? Saying the location of risk within a household is overlooked would be a dramatic understatement. We reconfigure the risk of your investments based on your goals and timeline.
19.) Bridging the Behavioral Gap
We help you understand and manage the emotional aspects of investing, ensuring that fear and regret don’t derail your financial success. The average person is influenced more by fear than joy. We regret our losses more than we celebrate our wins. Using a fiduciary financial planner helps you get the occasional reality check on the influence of your fears on your money.

Disclosures:
This information is intended for general informational purposes only and does not constitute financial advice. It is important to note that the specific outcomes and experiences of individual clients may vary significantly. Investment Planning Advisors cannot guarantee any particular results. Investment Planning Advisors is regulated by the Securities and Exchange Commission (SEC) and adheres to strict professional standards. However, individual investment results will vary based on a variety of factors, including market conditions, economic trends, and the specific financial goals and risk tolerance of each client. Past performance is not indicative of future results. Clients are encouraged to consult with their Investment Planning Advisor for personalized advice and to discuss any specific questions or concerns they may have.The information presented in the article is not a substitute for professional advice from a licensed attorney or accountant. Investment Planning Advisors Inc. and its representatives do not offer official tax and legal advice.
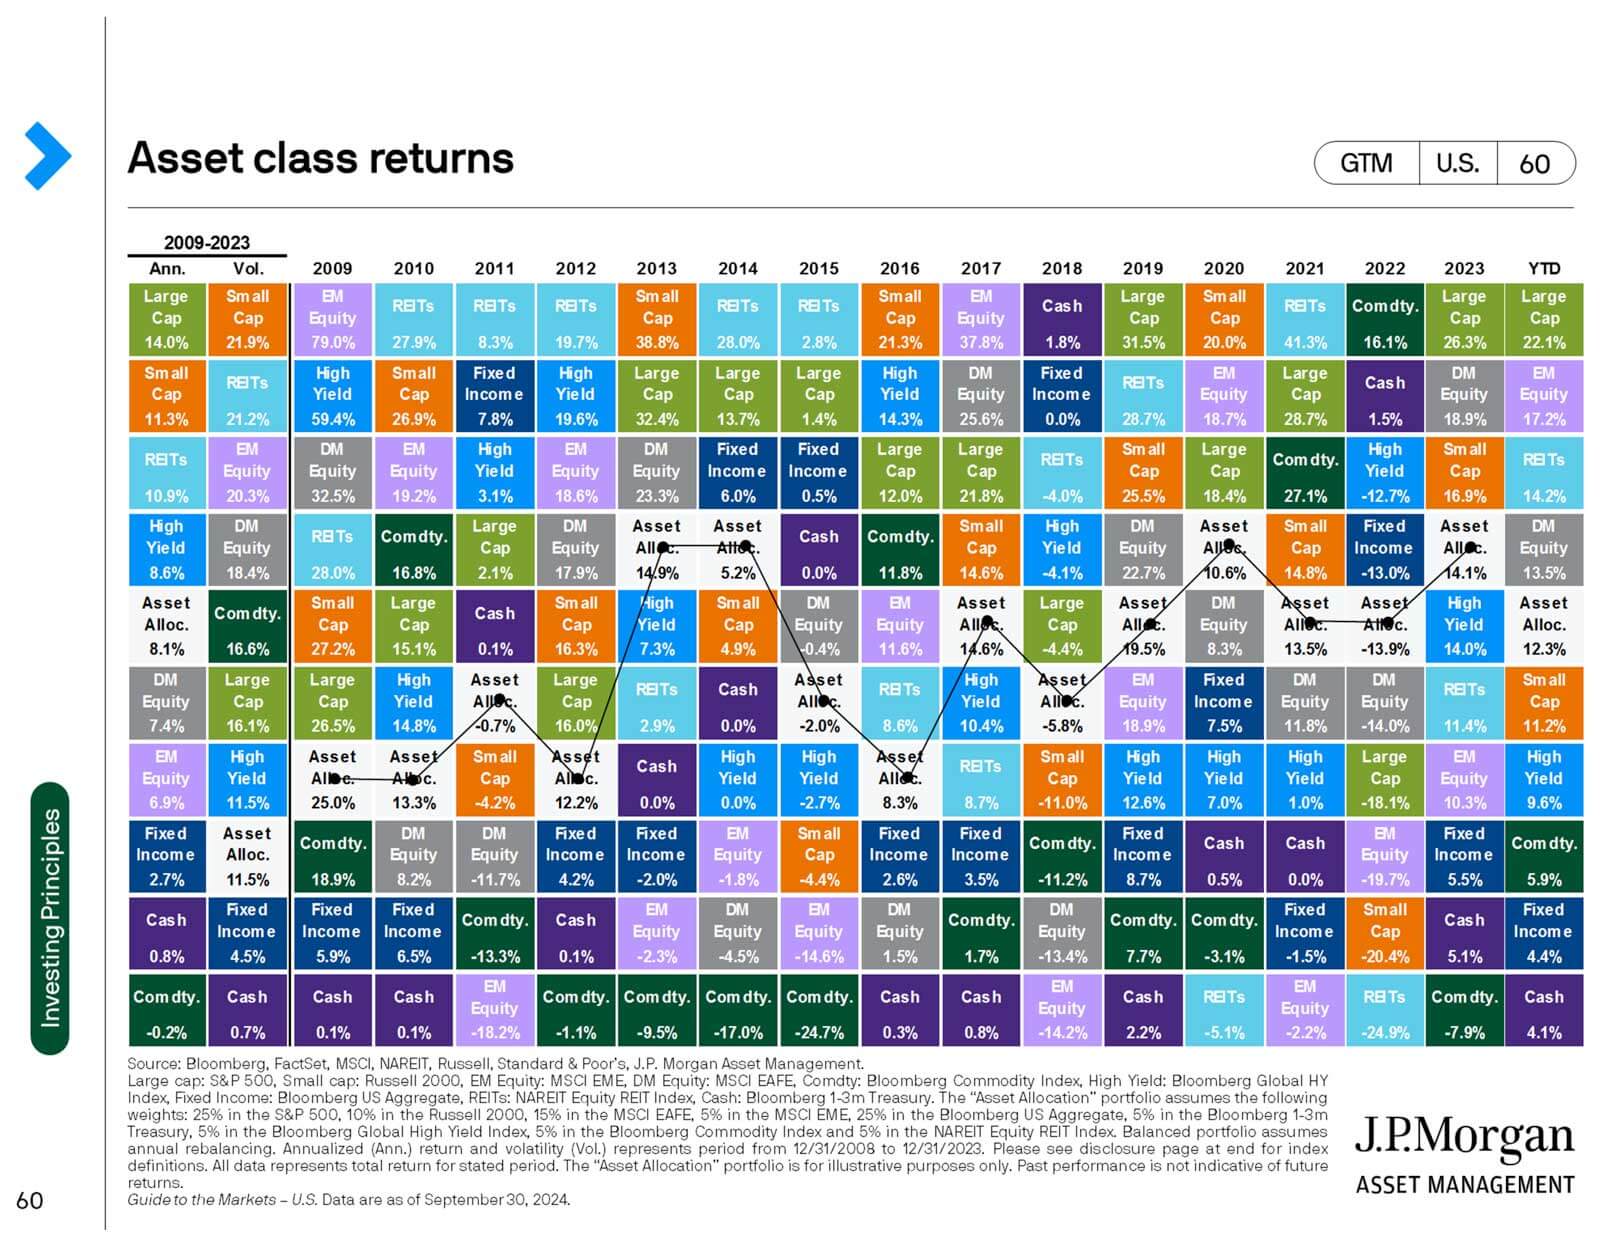
Asset Class Returns: Source: Bloomberg, FactSet, MSCI, NAREIT, Russell, Standard & Poor’s, J.P. Morgan Asset Management. Large cap: S&P 500, Small cap: Russell 2000, EM Equity: MSCI EME, DM Equity: MSCI EAFE, Comdty: Bloomberg Commodity Index, High Yield: Bloomberg Global HY Index, Fixed Income: Bloomberg US Aggregate, REITs: NAREIT Equity REIT Index, Cash: Bloomberg 1-3m Treasury. The “Asset Allocation” portfolio assumes the following weights: 25% in the S&P 500, 10% in the Russell 2000, 15% in the MSCI EAFE, 5% in the MSCI EME, 25% in the Bloomberg US Aggregate, 5% in the Bloomberg 1-3m Treasury, 5% in the Bloomberg Global High Yield Index, 5% in the Bloomberg Commodity Index and 5% in the NAREIT Equity REIT Index. Balanced portfolio assumes annual rebalancing. Annualized (Ann.) return and volatility (Vol.) represents period from 12/31/2008 to 12/31/2023. Please see disclosure page at end for index definitions. All data represents total return for stated period. The “Asset Allocation” portfolio is for illustrative purposes only. Past performance is not indicative of future returns. Guide to the Markets – U.S. Data are as of September 30, 2024.
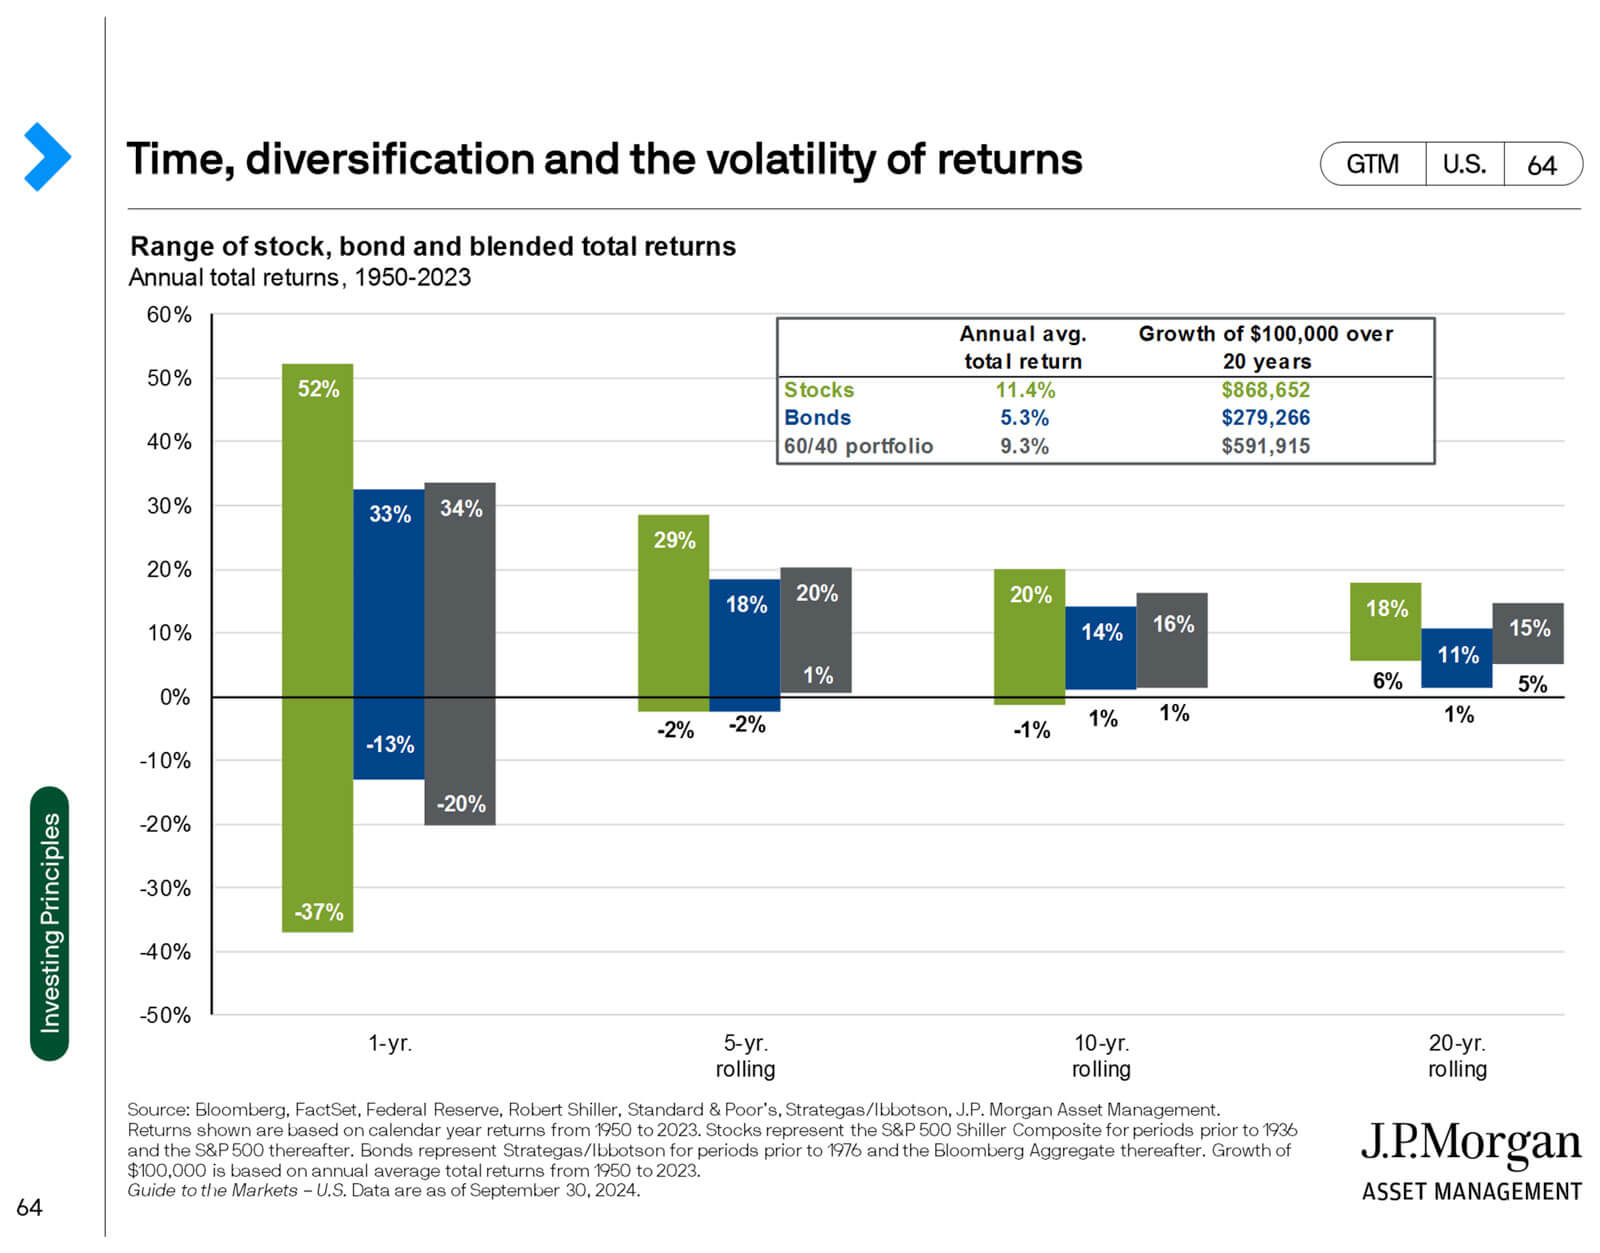
Time, Diversification, and the Volatility of Returns. Source: Bloomberg, FactSet, Federal Reserve, Robert Shiller, Standard & Poor’s, Strategas/Ibbotson, J.P. Morgan Asset Management. Returns shown are based on calendar year returns from 1950 to 2023. Stocks represent the S&P 500 Shiller Composite for periods prior to 1936 and the S&P 500 thereafter. Bonds represent Strategas/Ibbotson for periods prior to 1976 and the Bloomberg Aggregate thereafter. Growth of $100,000 is based on annual average total returns from 1950 to 2023. Guide to the Markets – U.S. Data are as of September 30, 2024.